
An MQTT broker severs as a hub for all MQTT messages and so it is important that it is always online and if not that you are ware of this.
There are several ways of monitoring the broker.
- Using the Ping Command
- Using the $SYS topic
- Sending messages through it.
- Monitoring Connection Status
Using the Ping Command
This very easy to implement as all machines support the ping command.
The ping command can be run manually or automatically.
The problem with it is that it doesn’t really monitor the MQTT broker but the machine that it is running on.
So if you were relying on this method if someone stopped the broker the ping command will not detect it as the machine is still up.
Video
Node-Red MQTT Broker Monitor Using Ping
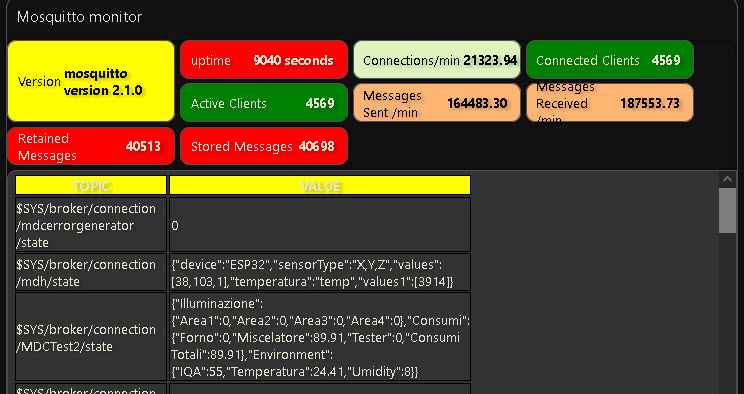
Using the $SYS Topic
Almost all broker publish broker statistics on the $SYS topic.
These are usually published at 5 second intervals but with the retain flag set.
If the broker is goes down then no statistics are published and so you will need to detect this.
Because only changes are published you need to monitor a topic that changes frequently.
However the $SYS topic can be disabled and so will not be available.
Flow Download

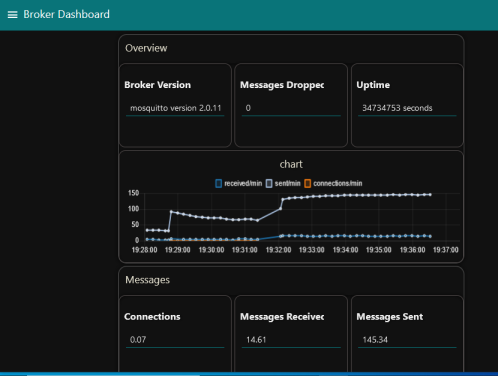
Broker Dashboard
This is a variation of the $SYS monitor and has a chart embedded. It is meant as a starter template for your own broker dashboard.
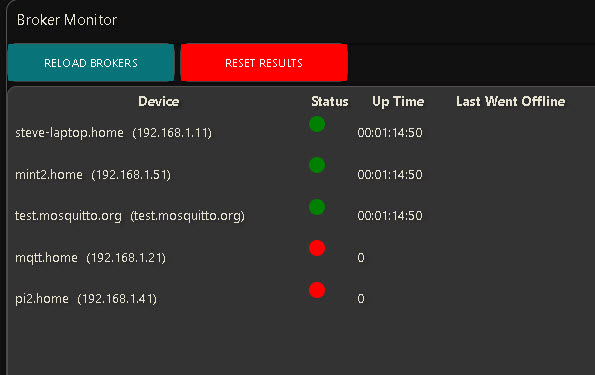
Monitoring Multiple Brokers
Node-red works well for 1 or two brokers and when only a few broker connections are required but adding more brokers involves adding more MQTT IN and OUT nodes.
Python on the other hand is much more flexible and when I need more flexibility then I use Python.
The basic idea is that Python does the data collection from the brokers and then re-broadcasts the data for node-red to pick up.
The python client rebroacasts oon the topic:
SYS_TOPICS/broker_name
so the data for the broker 192.168.1.21 would be rebroadcast on
SYS_TOPICS/192.168.1.21
The data is stored in a flow variable and can be displayed by selecting the broker for a drop down menu.

The python script is controlled form the node-red dashboard but to change the brokers that it monitors requires editing an array in the script.

You can download the flow and python script using the link below:
If you have any questions regarding the flow/script please let me know. Feedback both positive and negative is always welcome. Just use the ask-steve page
Sending and Receiving Messages
This IMO is the better method as you can monitor multiple instances separately.
Many MQTT brokers run MQTT over multiple ports to support SSL and Websockets.
In addition MQTT hosting providers run multiple instances of MQTT on a single machine.
A broker can be running
- Plain MQTT
- MQTT over SSL
- MQTT over websockets
- MQTT over websockets with SSL
- MQTT on Other Ports
The technique is to send a message to each instance and to monitor the received message.
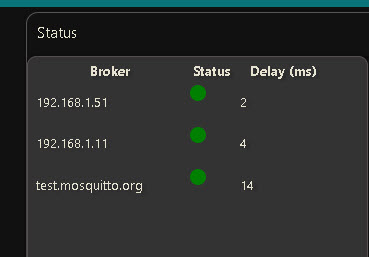
Monitoring Connection Status
I added this method after posting a video on monitoring.
All MQTT client nodess will report a connection failure which you can detect using the status node, and so you can use this to trigger an alert.
However personally I haven’t found this method fool proof which is why I didn’t include it initially. It is however probably the easiest to implement.
Monitor MQTT Broker Status and Delay Using Node-Red
Flow Download
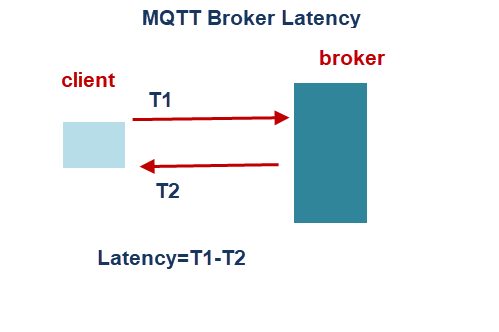
The message latency is the time taken for a message to be received from when it was published.
To measure the latency we simply publish a message and embed the publish time stamp and on receiving the message we can calculate the round trip time (message latency).
Factors Affecting Latency
There are several factors that affect the message latency the main ones are:
- Broker Load
- Network load and type
- Message size
- QOS level
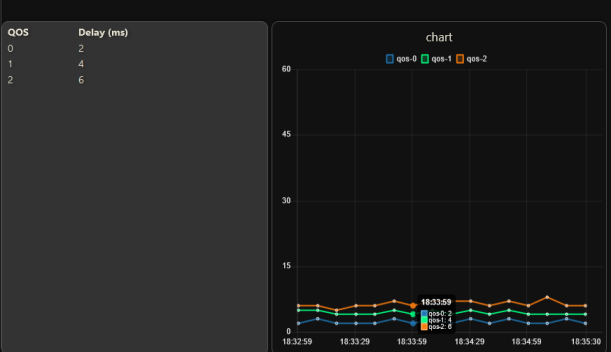
Node-Red QOS Test Tool
The node-red test tool allows you to compare the latency for different QOS levels and message sizes. The results are displayed in a graph and a table which is shown below:
They are also logged to a database. To log to the database you will need to set the database path in the sqlite node and also create the database table using the inject node as shown below.
Logging to a database should be disabled by default.You can enable logging using the switch. A database error will be caught in the catch node and will disable logging.
Flow Download
Related Tutorials and Resources:
- Tips for Testing the mosquitto broker on Linux
- MQTT Client Message Queueing and Delivery
- MQTT Keep Alive Interval Explained With Examples